


 Protocol Exerciser & Analysator")
 Protocol Exerciser & Analysator")


Description
The PGY-SMI-EX-PD SMI Protocol Analyzer provides comprehensive functions for capturing and debugging communication between host and DUT. The PGY-SMI-EX-PD can be configured as master or slave, generate SMI traffic and decode SMI packets. SMI, also referred to as Management Data Input/Output or MDIO, is a 2-wire serial bus used to manage physical layer devices in Media Access Controllers (MACs) in Gigabit Ethernet devices. The management of these PHYs is based on accessing and modifying their various registers.
Features PGY-SMI-EX-PD SMI Protocol Analyzer and Exerciser
- Supports SMI (MDIO) speeds up to 25MHz
- Configuration as master or slave
- Simultaneous SMI traffic generation and protocol decoding
- Support for SMI clause 22 and 45
- Variable SMI data speeds and duty cycle
- Continuous streaming of protocol data to the host computer to provide a large buffer
- Timing diagram of the protocol-decoded bus
- Listing view of log activity
- Ability to write a training script to combine the generation of multiple data frames at different data rates
- USB 2.0/3.0 interface for host computer
- API support for automation in Python or C++
Multi Domain View
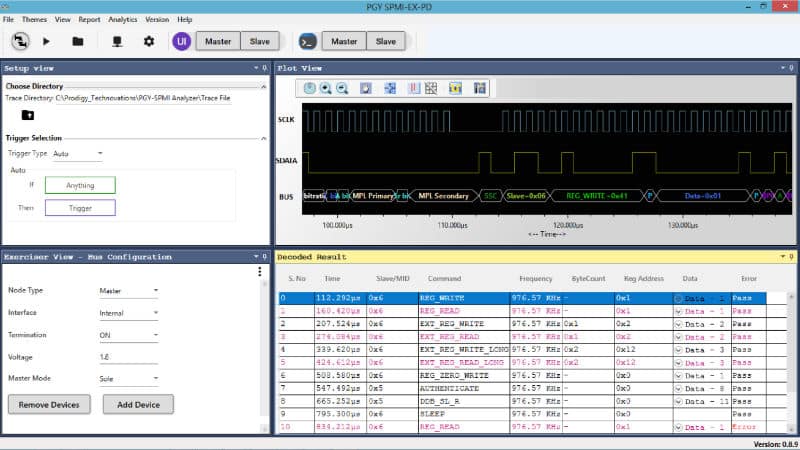
The multi-domain view provides a complete view of SMI log activity in a single GUI. The user can easily set up the analyzer to generate SMI traffic via a GUI or script. The user can capture the log activity at a specific event and decode the transition on the SMI line. The decoded results can be displayed in the timing diagram and log listing window with autocorrelation.
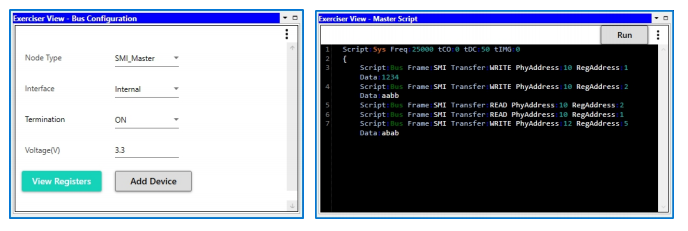
Exerciser
The PGY-SMI-EX-PD supports the generation of SMI traffic using GUI as well as script. The user can use the GUI to generate simple traffic to test the DUT. The scripted GUI provides the flexibility to emulate all expected traffic including error injections. In this example script, the user can generate SMI traffic as follows:
- Script line #1: Set system Frequency 25MHz, CLK to DATA delay to 0ns, Duty cycle 50%, System inter message gap to 0us
- Script line #3: WRITE
- Script line #4: WRITE
- Script line #5: READ
- Script line #6: READ
- Script line #7: WRITE
Timing Diagram and Protocol Listing View
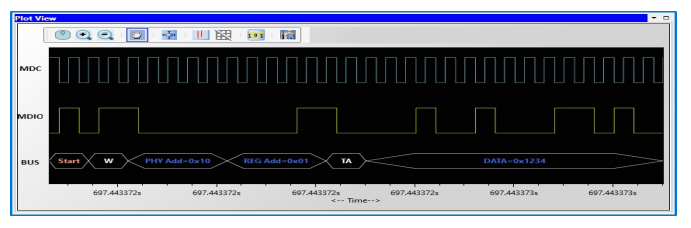
The timing view provides the display of MDC and MDIO signals with bus diagram. The overlay of the log bits on the digital timing waveform facilitates debugging of the decoded log data. The cursor and zoom functions make it easier to analyze the protocol on the timing diagram for any timing errors. The log window shows the decoded packet information in each state and all packet details with error information in the packet. Selected frames in the log window are automatically correlated in the timing view to show the timing information of the packet.
Warranty
Hardware and software are covered by a one-year warranty. Probes are covered three months warranty for all manufacturing defects
Documentation
Exerciser - Analyzer Communicationprotocol


Price on request


Price on request


Price on request

Price on request
")
Price on request


Price on request


Price on request

Price on request

Price on request


Price on request

Price on request
Price on request

Price on request